YantaiChangyu Pioneer Wine Co. Ltd. 2015 Annual Report Abstract
SharesCode: 000869,
1. Important Warning
ThisAnnual Report abstract comes from the whole contents of annual report. If investorsdesire to comprehend the Company’s operating results, financial situationand future development plan, please read the Annual Report on the mediaspecified by the China Securities Regulatory Commission.
Alldirectors personally attended the meeting for deliberating the annual report of2015.
Non-standardaudit opinion notice
□
Thepreliminary scheme of the report period’s common stock profit distribution or increasingequity with reserve deliberated by the board of the directors
R
Whetherto increase equity with reserve
□
TheCompany’s preliminary scheme of common stock profit distribution deliberatedand passed by the board of the directors is as following: Based on the Companytotal 685,464,000 shares on 31 December 2015,we plan to pay CNY 5 in cash as dividends for every10 shares (including tax) to the Company’s all shareholders, send 0bonus(including tax) and capital reserve will not be transferred to equity.
Thepreliminary scheme of this report period’s preferred share profit distribution deliberatedand passed by the board
□
BriefIntroduction of the Company
|
Abbreviation of the Shares: |
Changyu A, Changyu B |
Code number of the Shares |
000869, 200869 |
|
|
Place of listing of the Shares |
Shenzhen Stock Exchange |
|||
|
Abbreviation of the Shares after alteration (if have) |
- |
|||
|
Contact person and information |
Secretary to the Board of Directors |
Authorized Representative of the Securities Affairs |
||
|
Name |
Mr. Qu Weimin |
Mr. Li Tingguo |
||
|
Address |
56 Dama Road, Yantai, Shandong, China |
56 Dama Road, Yantai, Shandong, China |
||
|
Fax |
0086-535-6633639 |
0086-535-6633639 |
||
|
Tel |
0086-535-6633656 |
0086-535-6633656 |
||
|
|
quwm@changyu.com.cn |
stock@changyu.com.cn |
||
2. Main businesses during the report period orproduct brief introduction
Duringthe report period, the Company’s main businesses are to produce and operatewine and brandy, thus providing the domestic and foreign consumers with healthyand fashionable alcoholic drinks. Compared with earlier stage, there areno significant changes happened to the Company’s main businesses. The wineindustry that the Company involved in is still in the growth stage, the wholedomestic wine market is on the rising trend. The Company takes the dominantposition in the domestic wine market.
3. Key accounting data and financial indicators
(1) Key accounting data and financial indicators inrecent three years
Whetherthe Company makes retroactive adjustments or restates the accounting data ofprevious fiscal years because of changes of accounting policy and/or accountingerrors.
□
Unit: CNY
|
Item |
2015 |
2014 |
More or less than Last year (%) |
2013 |
|
Business revenue |
4,649,722,368.00 |
4,156,727,525.00 |
11.86% |
4,320,948,572.00 |
|
Net profit attributed to the shareholders of the listed company |
1,030,073,860.00 |
977,707,711.00 |
5.36% |
1,048,185,927.00 |
|
Net profit attributed to the shareholders of the listed company after deducting the irregular profit and loss |
993,268,823.00 |
950,191,379.00 |
4.53% |
1,017,348,285.00 |
|
Net cash flows from the operating activities |
1,143,046,367.00 |
1,070,083,296.00 |
6.82% |
735,074,307.00 |
|
Basic earnings per share (CNY/share) |
1.50 |
1.43 |
4.90% |
1.53 |
|
Diluted earnings per share (CNY/share) |
1.50 |
1.43 |
4.90% |
1.53 |
|
Weighted average for earning rate of the net assets |
14.30% |
13.96% |
0.34% |
16.45% |
|
|
Dec. 31st 2015 |
Dec. 31st 2014 |
More or less than Last year (%) |
Dec. 31st 2013 |
|
Total assets |
10,344,211,461.00 |
8,912,232,640.00 |
16.07% |
7,997,930,542.00 |
|
Net Assets attributed to the shareholders of the listed company |
7,564,099,003.00 |
6,840,452,145.00 |
10.58% |
6,208,279,705.00 |
(2) Key financial indicators by quarter
UNIT: CNY
|
|
1st Quarter |
2nd Quarter |
3rd Quarter |
4th Quarter |
|
Business revenue |
1,825,212,207.00 |
1,000,581,043.00 |
860,434,812.00 |
963,494,306.00 |
|
Net profit attributed to the shareholders of the listed company |
530,248,397.00 |
215,811,851.00 |
136,798,209.00 |
147,417,173.00 |
|
Net profit attributed to the shareholders of the listed company after deducting the irregular profit and loss |
526,745,613.00 |
212,686,390.00 |
133,641,945.00 |
120,396,645.00 |
|
Net cash flows from the operating activities |
697,396,327.00 |
229,766,733.00 |
292,071,264.00 |
-76,187,957.00 |
Whetherthere are differences between the above mentioned financial indicators or theirsum and the related financial indicators in the quarterly reports andsemi-annual reports disclosed by the Company.
□
4. Capital stock and shareholders’ situation
(1) Number of common stockholder and preferred shareholderrecovering voting power, and situation of shares held by topten shareholders
Unit: share
|
Total shareholders in the report period |
36,963 |
Total number of common shareholders by the end of last month before the disclosure day of the annual report |
36,502 |
Total number of preferred shareholder recovering voting power by the end of report period |
0 |
Total number of preferred shareholder recovering voting power by the end of last month before the disclosure day of the annual report |
0 |
|||
|
The top 10 shareholders holding situation |
||||||||||
|
Name of Shareholders |
Character of shareholders |
Percentage (%) |
Shares held until the end of the report period |
Number of restricted shares |
Pledged or frozen |
|||||
|
Share status |
Amount |
|||||||||
|
YANTAI CHANGYU GROUP CO. LTD. |
Domestic non-state-owned legal person |
0.00% |
345,473,856 |
|
|
|
||||
|
GAOLING FUND,L.P. |
Foreign legal person |
-2,876,078.00% |
21,300,919 |
|
|
|
||||
|
15,997,455.00% |
15,997,455 |
|
|
|
||||||
|
BBH BOS S/A FIDELITY FD - CHINA FOCUS FD |
Foreign legal person |
-530,200.00% |
15,576,126 |
|
|
|
||||
|
GREENWOODS CHINA ALPHA MASTER FUND |
Foreign legal person |
8,617,471.00% |
8,617,471 |
|
|
|
||||
|
GOLDEN CHINA MASTER FUND |
Foreign legal person |
5,415,971.00% |
7,389,916 |
|
|
|
||||
|
NORGES BANK |
Foreign legal person |
1,187,206.00% |
5,698,452 |
|
|
|
||||
|
CENTRAL HUIJIN ASSET MANAGEMENT LTD. |
State-owned legal person |
4,761,200.00% |
4,761,200 |
|
|
|
||||
|
GUOTAI JUNAN SECURITIES (HONGKONG) LIMITED |
Foreign legal person |
1,188,656.00% |
4,669,572 |
|
|
|
||||
|
FUGUO REFORM POWER MIXED SECURITIES INVESTMENT FUNDS |
Domestic non-state-owned legal person |
4,000,000.00% |
4,000,000 |
|
|
|
||||
|
The explanation for the associated relationship and accordant action |
Among the top 10 shareholders, Yantai Changyu Group Company Limited has no associated relationship or accordant action relationship with the other 9 listed shareholders, and the relationship among the other shareholders is unknown. |
|||||||||
|
Explanation for the top 10 shareholders who involved in financing activities and stock trading business (if any) |
NO |
|||||||||
(2) Number of preferred shareholder and situation ofpreferred shares held by top ten preferred shareholders
□
Thereare no shares held by preferred shareholders during the report period.
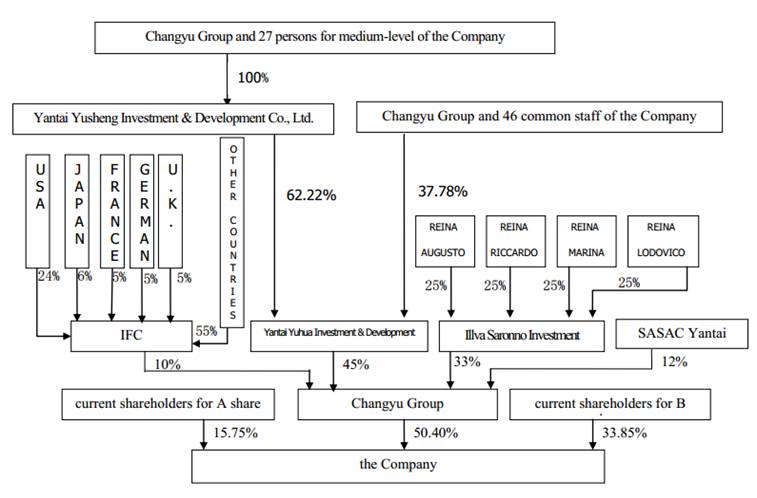
(3) Introduction for property right andcontrol relations between the Company and its actual controllers
|
||||
|
||||
5. Management Discussion and Analysis
(1) Brief introduction of operation situation duringthe report period
j Summarization
In 2015,influenced by the slowdown of domestic economic growth, the overall domesticwine industry is relatively stable, the effective demands for top-levelproducts is weakness, the medium-and-low-level products suitable for massconsumption maintains a favorable growth tendency. Because of the overwhelmingflow of foreign wine into Chinese market, the market competition is furtherintensified, which has brought bigger challenges for the Company to achieve sustainedand steady growth. Facing quite a lot of external disadvantages, the Company insists to focus on the market,adjust the marketing tactics and product structure, strive to develop mediumand low level products, optimize the market layout, perfect the marketingchannels and effort to promote product sales, achieving good results andrealizing business income of CNY 4649.72 million, an increase of 11.86% comparedwith last year; but due to the impact of decreasing the proportion of the salesin the products with high gross profit margin and increasing the proportion ofthe sales in the products with the low profit margin, the Company realized netprofit of CNY 1030.07 million belonging to the parent company’s shareholders , anincrease of 5.36% compared with last year.
k Analysis of main business
A) Summarization
|
Description |
Increase or decrease of the end of the period over the end of last year |
Cause of significant changes |
|
Operating revenue |
11.86% |
Mainly because of increased sales volume |
|
Operating cost |
10.21% |
Mainly because of the increase of sales volume, especially the proportion of sales in medium-low price products increased |
|
Sales expense |
20.39% |
Mainly because of the increase of advertising expense in 2015 |
|
Management expense |
22.18% |
Mainly because of increase of wage & welfare, depreciation and Property tax in 2015 over the last year before |
|
R&D investment |
10.18% |
Mainly because of increase of expenses for the development of technology research in 2015 |
|
Financial expense |
165.41% |
Mainly because of reduction of interest income due to decrease of time deposit balance, and the increase of loan interest expenditure. |
|
Net amount of cash flow generated in operating activities |
6.82% |
Mainly because of increased sale volume that makes cash inflow of business activities increased |
|
Net amount of cash flow generated in investment activities |
4.57% |
Mainly because of decline of cash expenditure for the investment projects |
|
Net amount of cash flow generated in capital-raising activities |
-1.57%
|
Mainly because of decline of other received cash related with financing activities |
Review andsummary of the process of the Company’s early-disclosed development strategyand business plan during the report period
During thereport period, influenced by the decelerated growth on the demand for domesticwine and intensified market competition, the Company has realized the businessincome of CNY 4.65 billion, increased by 11.86 % compared with the last year,exceeding the target fixed in the beginning of the year of realizing businessincome no less than CNY 4.4 billion. In order to deal with the unfavorablebusiness environment, the Company carried out the operation strategy of steadydevelopment in the medium and high-end wines, and vigorous expansion for thelow-level wines, brandy and imported wines with own brands. While makingefforts to promote the development of medium and high-end wines, the Companymade an appropriate tilt on marketing resources to the medium and low levelwines, brandy and imported wines with own brands for meeting the market demand,which played an important part in realizing the increase on the businessincome. The main work in the report period is as following:
Firstly, theCompany further strengthened the construction of marketing system, optimizedproduct structure, increased the marketing promotion efforts andenhanced the marketing capability.The Company further improved the multi-channel and multi-company marketingframework, making the sales system more smoothly from the top down; Byincreasing the investment in the wine market, strengthening the inspection ofterminal work, and strongly pushing the increase in sales of medium-and-lowlevel wines and the promotion of brandy, the Company accelerated the sales ofterminal and acquired greater improvement in marketing capability.
Secondly, theproduction management was strengthened and the production cost was reducedconstantly. The control of major production costs was strengthened and themanagement methods of both equipment repairing fee and fuel-power fee wereimproved. The Company strengthened the management of quota funds, perfected theexamination and evaluation system to occupied funds, and realized dynamicmanagement and paid use to fund occupation of each unit within the company. Theprocurement cost of raw materials was further reduced by increasing thecentralized procurement. Based on above measures, cost per ton of comparableproducts reduced CNY 181 over the same period of previous year.
Thirdly, theresearch for new products and new technologies was continued being conductedand the quality management was strengthened in order to improve technologicallevel and product quality. In 2015, the Company implemented 14 key technologiesand conducted 57 technological development projects; focused on ‘Quality Day’in every month to further intensify the examination and supervision of qualitysystem construction; further deepened the quality control of package materials,standardized the legality of package materials in combination withnewly-implemented ‘Food Safety Law’ and ‘Advertisement Law’. Based on abovemeasures, the inner quality of the company’s products got a stable improvement.Koyac XO Porcelain Barrel Brandy won Gold medal in Conours Mondial de Bruxelles2015-Spirits Selection and the Icewine won Gold medal in ‘QualityWine-Producing Areas of International Leaders Contest’.
Fourthly, theprocurement of raw materials such as grapes was completed successfully and themanagement of grape base was further strengthened. The Company completed thewhole year work of grapes procurement and processing according to the plan,which provides a reliable guarantee of raw material for adapting thedevelopment of market; strengthened thebudget management of various expense in self-supporting bases, tookcomprehensive professional training for farmers and strengthened the classifiedmanagement and classified evaluation of contractual bases; imported 102mechanized equipment, further improving the machinery utilization rate ofYantai self-supporting bases and each chateau base. By taking above mentionedmeasures, the Company’s grape base management has become more standardized andthe quality of grape has been much improved.
Fifthly, theconstruction of technological upgrading projects is steadily promoted tostrengthen momentum for future development. During the report period, theCompany has overcome the various problems and difficulties, steadily carryforward the construction of 9 investment projects which were defined at thebeginning of the year, the key investment projects run smoothly with goodengineering quality.
B) Revenue and cost
a) Composition of operating incomes
Unit: CNY
|
|
2015 |
2014 |
Year-on-year increase or decrease (%) |
||
|
Amount |
Proportion in operating incomes |
Amount |
Proportion in operating incomes |
||
|
Total operation revenue |
4,649,722,368.00 |
100% |
4,156,727,525.00 |
100% |
11.86% |
|
Industry-classified |
|||||
|
Industry of liquor and alcoholic beverage |
4,649,722,368.00 |
100.00% |
4,156,727,525.00 |
100.00% |
11.86% |
|
Product-classified |
|||||
|
Wine |
3,659,597,234.00 |
78.71% |
3,201,368,831.00 |
77.02% |
14.31% |
|
Brandy |
883,276,247.00 |
19.00% |
813,417,868.00 |
19.57% |
8.59% |
|
Others |
106,848,887.00 |
2.30% |
141,940,826.00 |
3.41% |
-24.72% |
|
Area-classified |
|||||
|
Domestic |
4,481,598,915.00 |
96.38% |
4,072,037,577.00 |
97.96% |
10.06% |
|
Abroad |
168,123,453.00 |
3.62% |
84,689,948.00 |
2.04% |
98.52% |
b) The condition of sectors, products or areasaccounting for over 10% in the Company’s operating incomes or operating profits
R
Unit: CNY
|
|
Operating income |
Operating cost |
Gross profit rate |
Year-on-year increase or decrease (%) of operating income |
Year-on-year increase or decrease (%) of operating cost |
Year-on-year increase or decrease (%) of gross profit rate |
|
Industry-classified |
|
|||||
|
Industry of liquor and alcoholic beverage |
4,649,722,368.00 |
1,512,503,035.00 |
67.47% |
11.86% |
10.21% |
0.49% |
|
Product-classified |
|
|||||
|
Wine |
3,659,597,234.00 |
1,145,785,230.00 |
68.69% |
14.31% |
13.35% |
0.27% |
|
Brandy |
883,276,247.00 |
307,213,390.00 |
65.22% |
8.59% |
10.72% |
-0.67% |
|
Area-classified |
|
|||||
|
Domestic |
4,481,598,915.00 |
1,456,071,487.00 |
67.51% |
10.06% |
8.45% |
0.48% |
Underthe condition of the adjustment of the Company’s main businesses data statisticalcaliber during the report period, the Company’s main businesses data of thelast year based on the adjusted caliber by the end of the report period
□
c) Whether the Company’s sales revenue for materialobject is more than labor income
R
|
Sector |
Project |
Unit |
2015 |
2014 |
Year-on-year increase or decrease (%) |
|
Wine |
Sales volume |
Ton |
86,318 |
71,854 |
20.13% |
|
Brandy |
Sales volume |
Ton |
40,074 |
37,462 |
6.97% |
Explanationon the causes of over 30% year-on-year changes of the related comparison data
□
d) The fulfillment of major sales contract signed bythe Company up to the report period
□
e) Compositionof operating costs
|
Sector |
Project |
2015 |
2014 |
Year-on-year increase or decrease (%) |
||
|
Amount |
Proportion in the operating cost (%) |
Amount |
Proportion in the operating cost (%) |
|||
|
Liquor and alcoholic beverage
|
Blending liquor |
813,179,854.00 |
54.76% |
749,104,077.00 |
55.29% |
-0.53% |
|
Packing material |
515,456,922.00 |
34.71% |
446,560,533.00 |
32.96% |
1.75% |
|
|
Wages |
55,456,767.00 |
3.73% |
53,632,561.00 |
3.96% |
-0.22% |
|
|
Production cost |
100,900,541.00 |
6.79% |
105,480,406.00 |
7.79% |
-0.99% |
|
Explanation
No
f) Information of major customers and majorsuppliers
TheCompany’s important customers
|
The total sales amount of the top five customers(CNY) |
162,300,452.00 |
|
Total sales of the top five customers accounting for the proportion in total sales for the year(%) |
3.49% |
Informationon the Company’s 5 biggest customers
|
No. |
Customer Name |
Sales Amount (CNY) |
Proportion in Total Sales for the year(%) |
|
1 |
ChangyueXin Trade Company in Shenzhen city |
35,452,036.00 |
0.76% |
|
2 |
Baicheng Trade Distribution Center in Hanjiang district of Putian city (New Baicheng Food Trade Company in Hanjiang district of Putian city, Zhongheng Food Trade Company in Chengxiang district of Putian city, Baicheng Commerce and Trade Company Limited in Putian city ) |
33,579,353.00 |
0.72% |
|
3 |
Dali Qianxingrong Wine Shop in Nanhai district of Foshan city (Xiqiaolizhi Shop in Nanhai district of Foshan city ) |
32,892,494.00 |
0.71% |
|
4 |
Wal-Mart (China) Investment Company Limited |
31,879,636.00 |
0.69% |
|
5 |
Huahaipengcheng Liquor Industry Company Limited in Zhuhai city |
28,496,932.00 |
0.61% |
|
Total |
— |
162,300,452.00 |
3.49% |
Othersituation explanation of main customers
□
Informationon the Company’s important suppliers
|
The total purchase amount of the top 5 suppliers |
57,512,952.00 |
|
The proportion of the total purchase amount of the top 5 suppliers in the annual purchase amount |
3.56% |
Informationon the Company’s top 5 biggest suppliers
|
No. |
Supplier Name |
Purchase Amount (CNY) |
Proportion in Total Purchase for the year(%) |
|
1 |
Yantai Shenma Packaging Co., Ltd. |
153,891,013.00 |
9.52% |
|
2 |
Yantai Changyu Glass Co.,Ltd. |
136,649,691.00 |
8.46% |
|
3 |
Liquan Sales Department of Shandong Yantai Winery Co.,Ltd. |
102,003,625.00 |
6.31% |
|
4 |
152 regiment of the eighth agriculture production division |
79,434,236.00 |
4.92% |
|
5 |
Yantai Wanfutai Winery Co., Ltd |
57,512,952.00 |
3.56% |
|
Total |
— |
529,491,518.00 |
32.77% |
Othersituation explanation of main suppliers
□
C) Costs
Unit: CNY
|
|
2015 |
2014 |
Year-on-year increase or decrease (%) |
Explanation of significant changes |
|
Sales expense |
1,211,127,163.00 |
1,006,009,364.00 |
20.39% |
Mainly because of increased advertising expense in 2015 |
|
Management expense |
313,968,409.00 |
256,980,018.00 |
22.18% |
Mainly because of increased wage, welfare expense, depreciation and building tax |
|
Financial expense |
11,287,685.00 |
-17,256,721.00 |
165.41% |
Mainly because of decreased interest income resulting from the decline of fixed deposit balance and increased loan interest expenditure |
D) Cash flow
Unit: CNY
|
Item |
2015 |
2014 |
Year-on-year increase or decrease (%) |
|
Subtotal of cash inflow in operating activities |
5,045,321,545.00 |
4,830,092,384.00 |
4.46% |
|
Subtotal of cash outflow in operating activities |
3,902,275,178.00 |
3,760,009,088.00 |
3.78% |
|
Net amount of cash flow generated in operating activities |
1,143,046,367.00 |
1,070,083,296.00 |
6.82% |
|
Subtotal of cash inflow in investment activities |
70,956,457.00 |
333,107,299.00 |
-78.70% |
|
Subtotal of cash outflow in investment activities |
1,008,811,136.00 |
1,315,841,068.00 |
-23.33% |
|
Net amount of cash flow generated in investment activities |
-937,854,679.00 |
-982,733,769.00 |
-4.57% |
|
Subtotal of cash inflow in capital-raising activities |
604,498,188.00 |
644,550,372.00 |
-6.21% |
|
Subtotal of cash outflow in capital-raising activities |
679,633,059.00 |
720,926,810.00 |
-5.73% |
|
Net amount of cash flow generated in capital-raising activities |
-75,134,871.00 |
-76,376,438.00 |
-1.63% |
|
Net increase of cash and cash equivalents |
134,207,390.00 |
3,913,342.00 |
3,329.48% |
Explanationof main influence factors contributing to great changes in related data onyear-on-year basis
R
Duringthe report period, comparing with the same period of last year, subtotal ofcash inflow in investment activities was reduced by 78.7%, mainly due to thesignificant decrease in the fixed deposit whose duration is more than 3 months;subtotal of cash outflow in investment activities was reduced by 23.33%, mainlydue to the significant decrease in cash paid for purchasing and constructingfixed assets, intangible assets and other long-term assets; net increasedamount of cash and cash equivalents increased by 3329.48%, mainly due to thesignificant growth of net amount of cash flow generated both in operatingactivities and in investment activities.
Explanationon the causes of the major differences between the net cash flow generated bythe Company’s operating activities and this year’s net profit during the reportperiod
R
Duringthe report period, there are no major differences between the cash flowgenerated by the Company’s operating activities and this year’s net profit.
ƒ Assets and liabilities situation
Unit: CNY
|
|
At the end of 2015 |
At the end of 2014 |
Proportion increase or decrease (%) |
Explanation on major changes |
||
|
Amount |
Proportion in the total assets (%) |
Amount |
Proportion in the total assets (%) |
|||
|
Monetary funds |
1,285,362,414.00 |
12.43% |
1,145,365,071.00 |
12.85% |
-0.42% |
No major changes |
|
Receivables |
197,795,091.00 |
1.91% |
145,672,411.00 |
1.63% |
0.28% |
No major changes |
|
Inventory |
2,260,852,964.00 |
21.86% |
2,087,376,398.00 |
23.42% |
-1.56% |
No major changes |
|
Investment real estate |
|
0.00% |
|
0.00% |
0.00% |
No major changes |
|
Long-term equity investments |
|
0.00% |
|
0.00% |
0.00% |
No major changes |
|
Fixed assets |
3,089,245,185.00 |
29.86% |
2,532,682,355.00 |
28.42% |
1.44% |
No major changes |
|
Construction in progress |
2,005,990,308.00 |
19.39% |
1,700,466,500.00 |
19.08% |
0.31% |
No major changes |
|
Short-term borrowings |
665,581,921.00 |
6.43% |
300,000,000.00 |
3.37% |
3.06% |
No major changes |
|
Long-term borrowings |
71,686,629.00 |
0.69% |
209,380,000.00 |
2.35% |
-1.66% |
No major changes |
(2) Whether there are major changes to the mainbusiness during the report period
□
(3) The condition of products accounting for over10% in the Company’s operating incomes or operating profits
R
Unit: CNY
|
Product name |
Operating income |
Operating cost |
Gross profit rate |
Year-on-year increase or decrease (%) of operating income |
Year-on-year increase or decrease (%) of operating cost |
Year-on-year increase or decrease (%) of gross profit rate |
|
Wine |
3,659,597,234.00 |
1,145,785,230.00 |
68.69% |
14.31% |
13.35% |
0.27% |
|
Brandy |
883,276,247.00 |
307,213,390.00 |
65.22% |
8.59% |
10.72% |
-0.67% |
(4) Whether there are features of operating seasonalityor periodicity required special attention
□
(5) Explanation for the operating income, operatingcost, total net profit attributed to the common shareholders of the listedcompany or constituting major changes compared with former report period
□
(6) Face of suspension and termination of listing
□
6. Related items involving financial report
(1) Explanation for the changes of the accountingpolicy, accounting estimation and accounting method
□
Thereare no changes to the accounting policy, accounting estimation and accountingmethod during the report period.
(2) During the report period, the situationexplanation for the correction of major accounting errors which need to be retrospectand restated
□
Thereis no situation for the correction of major accounting errors which need to beretrospect and restated.
(3) Compared with the previous year’s financialreport, explanation for the changes of the consolidated statements scope.
R
Forconsolidation scope of the year, please refer to Notes VIII "Equity inother entities" in detail. For detail of changes in consolidationscope of the year,N please refer to Notes VII "Change in consolidationscope".
(4) The Board of Directors’ and the Board ofSupervisor give the explanation for ‘no standard auditing report’ issued by theaccounting firm during this report period.
□